Justin Verlander and Gerrit Cole — two teammates, chasing one historic honor

By Jeff Lombardi Jr.

In the year of the home run, it was a pair of pitchers that stole the show in 2019. One may point to the astonishing number of home runs being hit – 6,776 to be exact, yet it was two pitchers who shined brightest in 2019. And not just any pairing of pitchers, these two are teammates nonetheless in Justin Verlander and Gerrit Cole of the Houston Astros.

Under the assumption that Verlander and Cole finish 1-and-2 in the American League Cy Young Award voting, it will be just the fifth time in MLB history that a pair of teammates accomplished such a feat. The others: Randy Johnson and Curt Schilling in 2001, and again in 2002, Mike Marshall and Andy Messersmith in 1974 and the duo of Don Newcombe and Sal Maglie in 1956.

Teammates to finish 1 -2 in Cy Young Award

MLB History

Randy Johnson       Curt Schilling                         ARI           2002 NL

Randy Johnson       Curt Schilling                         ARI           2001 NL

Mike Marshall       Andy Messersmith                 LAD          1974 NL

Don Newcombe     *Sal Maglie                              BRK           1956 MLB
*Maglie was traded from CLE to BRK mid-season

However, the Verlander/Cole combination are like no other. There would not be much of argument in favor of Curt Schilling deserving the award over Randy Johnson in either of those seasons. The same could be said for Messersmith over Marshall, at least according to the voters. Marshall made all 106 of his appearances as a reliever, earning 17 of 22 first place votes. After all, Johnson received 98% (30/32) of the vote in 2001, and actually bested himself by being a unanimous selection in 2002 – no voter fatigue there. The Verlander/Cole Cy Young balloting is shaping up to be one for the ages. There truly is not one right answer or a clear favorite in the jockeying for the American League’s top pitcher in 2019.

2019 season comparison

Justin Verlander    –                 Gerrit Cole

21-6                           W-L          20-5

223                             IP              212.1

2.58                           ERA          2.50

12.1                           K/9           13.8

.172                           BAA          .186

0.80                           WHIP       0.90

Johnson and Schilling will be the most common tandem thrown around when comparing the 2019 model of Verlander and Cole. Especially given that Verlander notched his 300th strikeout of the season in his final start of the 2019 campaign, joining Cole set the new franchise mark with 326. Johnson (334) and Schilling (316) are the only other teammates in MLB history to reach the 300-strikeout mark in the same season (2002). Additionally, with Verlander and Cole finishing with 21 and 20 wins respectively it is the first time a team had two 20-game winners since 2002 when Randy Johnson and Curt Schilling did it for the Diamondbacks, as did Pedro Martinez and Derek Lowe of the Red Sox.

While this argument isn’t to slight the spectacular seasons Johnson/Schilling. In fact, the dominance they had over two consecutive seasons is exactly why their names are brought up in this discussion. With that being said, the margin between two teammates who are bound to finish 1-2 in the Cy Young balloting has never been as good as what has unfolded in 2019.

2001 season comparison                       2002 season comparison

Johnson      –              Schilling                Johnson      –                Schilling

21-6            W-L          22-6                          24-5             W-L          23-7

249.2           IP              256.2                        260              IP              259.1

2.49             ERA          2.98                          2.32             ERA          3.23

13.4             K/9           10.3                          13.4              K/9           10.97

.203             BAA          .245                          .208             BAA          .224

1.01             WHIP       1.08                          1.03             WHIP       0.97

 Take this into consideration; in the expansion era (since 1961) there have been 13 instances when a pair of teammates finished top two in their respective league in ERA. Since 2000 there have been only four: Kyle Hendricks and Jon Lester in 2016, Roger Clemens and Andy Pettitte in 2005, Pedro Martinez and Derek Lowe in 2002 and Johnson/Schilling in 2001, not 2002. Only in the case of Hendricks (2.13)/Lester (2.44) and Clemens (1.87)/Pettitte (2.39) would both pitchers finish with lower ERAs than Cole (2.50)/Verlander (2.58).

In the same span there have been five pairs of teammates to finish first and second in the MLB in strikeouts: Verlander and Max Scherzer in 2012, Kerry Wood and Mark Prior in 2003, Johnson and Schilling in 2001 and 2002, Nolan Ryan and Frank Tanana in 1976 and Don Drysdale and Sandy Koufax in 1962. By those standards, Verlander and Cole would rank third.

Most Combined K’s by teammates to finish 1-2 in MLB

Expansion Era (since 1961)

Johnson/Schilling                    665           2001

Johnson/Schilling                    650           2002

Verlander/Cole                       626           2019

Ryan/Tanana                           588           1976

Wood/Prior                               511           2003

Verlander/Scherzer                470           2012

Drysdale/Koufax                     448           1962

Now here’s the catch. There’s no denying how appealing strikeouts are. Especially in the era of the three true outcomes (K, BB, HR). It’s worth mentioning that 2019 marks the 11th straight season where the league-wide strikeout record has been broken. With Verlander and Cole both joining the 300 K club this season, there has been at least one pitcher to record 300+ strikeouts in four of the last five seasons, including each of the last three. (Kershaw 301, 2015 – Sale 308, 2017 – Scherzer 300, 2018 – Cole 316, 2019/Verlander 300, 2019).

The ultimate job of a pitcher is run prevention – to give your team the best chance of winning by limiting the opposition. This is done by limiting the amount of base runners allowed via walk or hit, measured by a pitcher’s WHIP. Since 1961, there has been one pair of teammates to finish 1-2 in MLB in WHIP: Don Sutton (0.99) and Jerry Reuss (1.02) in 1980. Verlander’s WHIP of 0.80 and Cole’s 0.90 best both of those figures. To put this into further historical significance, Verlander’s WHIP ranks third among pitchers with at least 200 innings pitched in a single-season in the modern era.

Lowest WHIP in a single-season

Modern Era (since 1900) *Min. 200 IP

Pedro Martinez      0.74         2000

Walter Johnson      0.78         1913

Justin Verlander    0.80         2019

Addie Joss                0.81         1908

Greg Maddux         0.81         1995

Verlander has also limited his opponents’ batting average at a historic rate. His .172 batting average against ranks fourth in MLB history among pitchers who have thrown 200 innings in a single-season.

 Lowest BAA

Single Season – MLB History *Min. 200 IP

Pedro Martinez      .167         2000

Luis Tiant                  .168         1968

Nolan Ryan              .171         1972

Justin Verlander    .172         2019

Max Scherzer         .178         2017

For those who are still crazed by staggering strikeout totals, Houston’s duo stacks up quite well – and not just to Johnson/Schilling of 2001-02. Gerrit Cole’s staggering 13.8 strikeouts per nine innings is the highest figure in the modern era among pitchers who have thrown 200 innings in a single-season. Verlander sits at 12.7, good for second in the American League in 2019.

Highest K/9 in a single-season

Modern Era (since 1900) *Min. 200 IP

Gerrit Cole               13.8         2019

Randy Johnson       13.4         2001

Pedro Martinez      13.2         1999

Chris Sale                 12.9         2017

Randy Johnson       12.6         2000

Cole and Verlander’s dominance has been shown through their raw strikeout numbers as well as their rate per nine innings pitched. Well how about their frequency per batter they face, which is essentially a batting average type calculation for the amount of strikeouts induced by a pitcher. Gerrit Cole’s K rate of 39.9% is also the highest in the modern era among pitchers who have thrown 200 innings in a single-season. And even old reliable, Justin Verlander cracks the list, ranking fifth in the modern era at 35.4%.

Highest K Rate

Single Season – MLB History

Gerrit Cole               39.9%      2019

Pedro Martinez      37.5%      1999

Randy Johnson       37.4%      2001

Chris Sale                 36.2%      2017

Justin Verlander    35.4%      2019

*Min. 200 IP

And who doesn’t like a good streak. Joe DiMaggio is revered for his 56 game-hitting streak in 1941, or baseball’s Iron Man Cal Ripken Jr. who played in 2,632 consecutive games from 1982-1998. And for the sake of the long ball extraordinaires among us, let’s not forget about Dale Long, Don Mattingly and Ken Griffey Jr. who each homered in eight consecutive games.

In the Astros season finale, Gerrit Cole became the first pitcher in baseball history to strikeout 10 or more batters for the ninth consecutive game. And if that wasn’t good enough, Cole extended his consecutive starts without a loss streak to 22 – matching Roger Clemens’ streak in 1998 for the second-longest of it’s kind in baseball history. Cole pitched to a perfect 16-0 mark with a 1.78 ERA, while Houston went 20-2 over that span of starts.

Most Consecutive Games with 10+ K            Most Consecutive Starts without a loss

MLB History                                                         MLB History – Single Season

Gerrit Cole             9              2019                      Dave McNally         26            1969

Chris Sale                 8              2017                      Gerrit Cole             22            2019

Chris Sale                 8              2015                       Roger Clemens       22           1998

Pedro Martinez      8              1999                         Lefty Grove            21           1931

*Cole’s streak is active                                            Mike Fiers              21           2019

Although this is foreseen to be a two horse race, there have been two such occasions where a pitcher has won the Cy Young Award without receiving the most first place votes. In 2009, Tim Lincecum won his second consecutive award in the NL, while Adam Wainwright edged him in first place votes 12-11. That voting was actually a three horse race as Wainwright finished third in the voting. The runner up? Wainwright’s St. Louis Cardinals teammate, Chris Carpenter.

Lincecum lead the senior circuit in strikeouts, while Carpenter owned a league best 2.24 ERA and Wainwright paced the league in wins and innings pitched. The other occurrence was in 1998, also in the National League, when Tom Glavine won the award over Trevor Hoffman. Glavine received 11 first place votes, while Hoffman received 13.

2009 NL Cy Young Voting

Stat                            Lincecum             Carpenter                Wainwright

W-L                            15-7                           17-4                           19-8

IP                                225.1                         192.2                         233

ERA                            2.48                           2.24                           2.63

K/9                             10.4                           6.7                              8.2

WHIP                         1.05                           1.01                           1.21

1st place votes        11 (63%)                     9 (59%)                     12 (56%)

There is no right answer to who should win the 2019 AL Cy Young Award. Justin Verlander has one Cy Young Award under his belt in his MVP season of 2011. However, he has three second place finishes in the award (2012 – Price, 2016 – Porcello and 2018 – Snell). Obviously it is not to the extent of another Hall of Fame fire baller with Houston ties, Nolan Ryan, who went his entire 27 year career without winning the award (six top-5 finishes).

JV’s situation has somewhat of a Trout like feel to it. Trout, undoubtedly the best player of his generation has two AL MVPs (2014, 2016) but has also fallen runner-up on four occasions (2012 – Cabrera, 2013 –Cabrera, 2015 – Donaldson and 2018 – Betts). Verlander, undoubtedly one of the best in all of baseball, if not the best American League pitcher of his generation could be looking at his fourth second place effort. If Verlander comes out on top, he would set the MLB record for most seasons (7) between Cy Young Awards.

Justin Verlander Season Notes

  •  Led MLB pitchers in WHIP (0.80), Opp. AVG (.172), W (21), IP (223). Ranked T-1st in the AL in Quality Starts (26) and 2ndin ERA (2.58) and Opp. OPS (.579).
  • Won 20 games for the second time in his career (24 wins in 2011).
  • His 0.80 WHIP was the third lowest by a starting pitcher in the Modern Era (since 1900) behind only Pedro Martinez (0.74 in 2000) and Walter Johnson (0.78 in 1913).
  • Started the All-Star game for the American League (2nd of his career, 2012).
  • Became the American League’s oldest 20 game winner since Mike Mussina won 20 games at 39 years-old in 2008.
  • Career-high 300 strikeouts (previous high: 290 in 2018).
  • Threw the 3rdno-hitter of his career on Sept. 1 at TOR – 6th pitcher with 3+ no-hitters.
  • Became the 18thpitcher in MLB history to strikeout 3,000 batters. Doing so in the 4th fewest innings (2,979.2) and fifth (453) in terms of games.
  • Became the second pitcher in MLB history to reach 300 K for a season and 3,000 K for a career – in the same season, joining Randy Johnson (who else) who did so on 9/10/2000 at FLA
  • Marked the 12th season of his career with 200 innings pitched (fourth consecutive).
  • Named the 2019 Astros Pitcher of the Year by the Houston Chapter of the Baseball Writers Association of America.

Gerrit Cole Season Notes

  • Led MLB pitchers in K (326) and ranked 2nd in W (20), Opp. AVG (.186). Led the AL in ERA (2.50), Opp. OPS (.579) and T-1 in Quality Starts (26)
  • Recorded the highest strikeout rate (39.9%) and K/9 (13.8) in MLB history – previous record for K/9 was held by Randy Johnson (13.41 in 2001).
  • Set the Astros franchise record for strikeouts (316)
  • Did not suffer a loss over his final 22 starts of the season, the second longest single-season streak of its kind in baseball history: 16-0, 1.78 ERA, 146.2 IP, 226 K, .171 BAA over that span.
  • Recorded 10+ strikeouts in each of his final 9 starts, setting a MLB record.
  • Finished the season with a HOU franchise record 16-game winning streak – the longest in a single-season since Roger Clemens in 2001.
  • His 326 K’s are the most in the MLB since Randy Johnson had 334 in 2002 (ARI). It is the most by an AL pitcher since Nolan Ryan had 341 in 1977 (CAL).
  • Became the fourth pitcher in MLB history to have 21 double-digit strikeout games (Sandy Koufax, Nolan Ryan and Randy Johnson 3x).
  • Set the single-season MLB record by recording seven starts with 10+ K and no walks. The previous record of six was held by Schilling (2002), Johnson (2004) and Clayton Kershaw (2016).
  • Was named the AL Pitcher of the Month in June, July and September.

One more thing…

                Verlander/Cole     RJ/CS 2001              RJ/CS 2002

ERA          2.54                           2.74                           2.77

K/9           12.9                           11.8                           11.3

WHIP       0.85                           1.04                           1.00


A deeper look at Carlos Correa: an improved approach at the plate may be crucial to Houston’s title hopes

By Jeff Lombardi Jr.

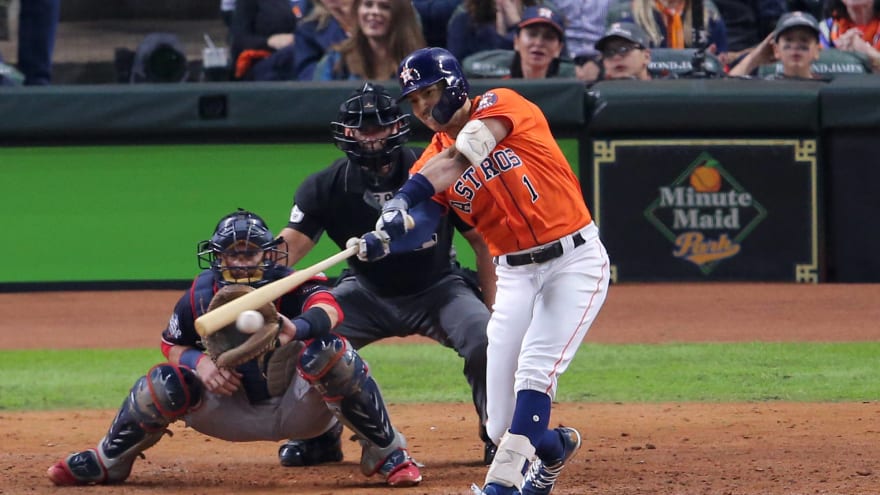
Carlos Correa has been in the middle of the biggest moments of the Astros’ 2019 postseason. For those who’ve been tuned in for its entirety, there are several Correa moments that stick out: his scamper and throw to nab DJ LeMahieu at the plate, which led to his eventual walk-off home run in Game 2 of the ALCS. Or what about his 94.5 mph throw on the back end of a double play in the ALCS clincher? Or his run-saving stab in Game 1 of the World Series.

And while he has those moments to cling to, the Astros are going to need one of the best postseason performers in franchise history to turn it around if they’re going to dig themselves out of an 0-2 series hole and win their second title in the last three years.

Correa is hitting at a .160 clip over his first 13 games this October, logging just four extra-base hits while striking out a whopping 22 times in just 53 plate appearances!

It would be silly to completely rule out a turnaround from Correa over the season’s final few games. As previously mentioned, he is one of the best postseason performers in franchise history –having logged a .860 OPS with 8 HR and 24 RBI in his first 32 career postseason games prior to this season.

But the underlying statistics don’t suggest Correa will suddenly start raking.

Career 2019 — Reg. Season — 2019 Postseason

K-Rate: 20.9% — 23.4% — 41.5%

Chase Rate: 27.6% — 28.2% — 37.4%

BB Rate: 10.8% — 10.9% — 5.7%

Correa saw 4.11 pitches per plate appearance during the regular season. That figure has slipped down to 3.94 during the postseason. Considering that he has struck out or walked in just under half of his plate appearances, that total is alarmingly low.

Correa has been chasing pitches outside of the zone at a 37.4% clip, the fourth highest of any batter who has seen at least 60 pitches outside of the strike zone during the postseason.

Highest Chase Rate 2019 Postseason

Didi Gregorius 46.8%

Marcell Ozuna 41.4%

Gary Sanchez 39.6%

Carlos Correa 37.4%

*Min. 60 pitches out of the zone

Furthermore, his chase rate on fastballs this postseason is 18.7% — fourth highest among hitters who have seen 60 such pitches outside of the zone. Fastballs are the pitch against which Correa typically does the most damage: he slugged .632 (his highest of any pitch) while his whiff rate was just 19.8% (his lowest of any pitch) during the regular season.

Highest Chase Rate on Fastballs 2019 Postseason

Juan Soto 23.3%

Gary Sanchez 20.8%

Jose Altuve 19.0%

Carlos Correa 18.7%

*Min. 60 FB

Besides chasing pitches out of the zone, he’s missing pitches in the zone.

During the regular season, Correa’s .360 batting average and .781 slugging percentage on pitches in the zone were the second-highest on the Astros, behind Yordan Alvarez (.373/.789). Correa has hit just .242 while slugging .485 on such pitches during the postseason.

If the Astros make this a series, don’t be surprised if Correa is a major factor. If they don’t, don’t be surprised if his struggles are a major part of the blame.

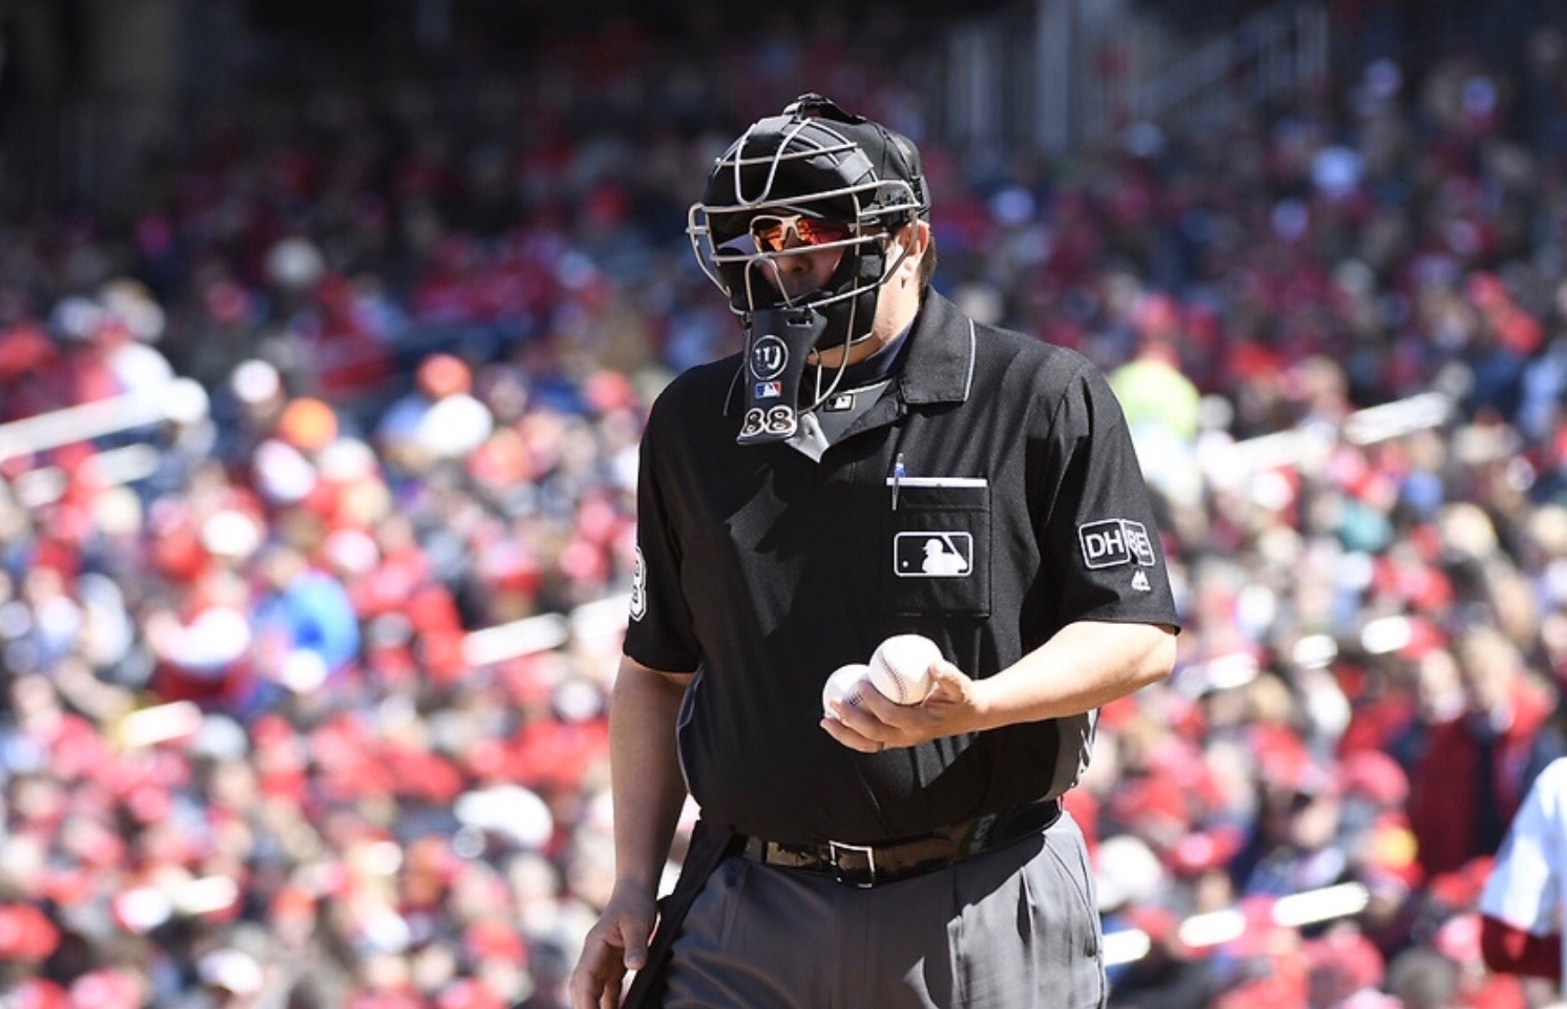
A look at World Series Game Two home plate umpire Doug Eddings

By Jeff Lombardi Jr.

Doug Eddings will have the responsibility of calling balls and strikes for the two hurlers – the first World Series plate assignment of his 21-year career.

 Eddings was behind the plate for a notable Game 2 back in the 2005 ALCS. His indecisive call on a dropped third strike allowed then White Sox catcher A.J. Pierzynski to reach first base as the Angels vacated the field in belief that they had recorded the third out. Pierzynski represented the go-ahead run in the bottom of the ninth inning. Pablo Ozuna pinch ran for Pierzynski and came around to score the winning run as the following batter, Joe Crede hit a walk-off double.

 In Wednesday’s action, both starters (and whoever takes the mound behind them) should be excited to see Eddings in the home plate gear. During the regular season, Eddings owned a 33.4 called strike percentage on pitches outside of the zone – good for second highest among all officials.

 Highest Called Strike Percentage

Pitches outside of the zone

Alex Tosi                    34.5%

Doug Eddings            33.4%

Of all of the zones of the plate, Eddings tends to call the high pitch the most. His 26.6 called strike percentage on pitches out of the zone, located up and away was the fourth highest in MLB. His called strike percentage on pitches out of the zone located up-middle of 49.6% ranked 6th during the regular season.

Highest Called Strike Percentage out of the zone

Pitches Up and Away

Bill Miller                   27.6%

Scott Barry                             27.1%

Adrian Johnson           27.0%

Doug Eddings            26.6%


Highest Called Strike Percentage out of the zone

Pitches Up and Middle

John Bacon                             63.9%

Brennan Miller                        56.3%

Shane Livensparger                 54.3%

Ben May                                 51.7%

Nick Mahrley                         51.5%

Doug Eddings                        49.6%

This plays more into the repertoire of Stephen Strasburg than it does Justin Verlander. During the regular season, Strasburg threw 54.9 of his pitches out of the zone. Strasburg has started seven games in his career with Eddings serving as the home plate umpire – which is tied for the second with James Hoye for most games as the HP umpire in a Strasburg start (40.1 IP, 5.58 ERA 59 K, 13 BB).

 In comparison, Verlander threw 48.5% of his pitches outside of the zone – slightly less than the league average of 51.1%. Verlander has started four games in his career with Eddings calling balls and strikes (30.2 IP, 3.23 ERA, 32 K, 5 BB).

Mark Simon of Sports Info Solutions describes Eddings concisely:

“His can be a wide zone horizontally and a large zone vertically. He’s arguably the most likely umpire in baseball to call a borderline pitch a strike and the most likely in this series to get on hitters’ nerves.”


Clayton Kershaw will get the ball sometime in NLDS Game 5

By Jeff Lombardi Jr.

Dave Roberts says that Kershaw will piggyback Buehler and pitch more than one inning.

I happen to like what Bruce Schein said on Tuesday’s High Heat with Christopher Russo. Schein said don’t be surprised to see Kershaw—not closer Kenley Jansen—on the mound to get the final outs.

Clayton Kershaw took the ball in Game Two of this Washington series…and lost. It got pretty ugly, pretty quick. Four of the first five batters reached base: double, walk, hit by pitch, single. The only out was a lousy bunt that was popped up. The 26 pitches was his second-highest total of any first inning he pitched all season – yet he escaped allowing just one run. Victor Robles was hit by pitch to lead off the second inning, Kershaw’s second HBP after facing just eight batters – he had hit just two of the 706 batters he faced during the regular season. After a pair of two out, RBI knocks Kershaw and the Dodgers were looking up at a 3-0 deficit through the first two frames.

Kershaw was able to write the ship, allowing just two additional baserunners to reach over his final four innings of work, but the damage was already done. The Nationals evened the series at one game apiece and what the Twitter-sphere has labeled as “Playoff Kershaw” was in full effect.

 Clayton Kershaw

Career Postseason Statistics – 31 G/25 GS

W-L      9-11

ERA    4.33

IP        158

*LAD: 15-16 record in PS games Kershaw has appeared in

Kershaw has appeared in 10 of 16 season ending or series clinching games for the Dodgers over his postseason career, including 10 of the last 13.

Clayton Kershaw appearances in Dodgers season ending/clinching games

YEAR              SERIES/GM              OPP    IP        RESULT

2010                NLCS  5                      PHI     5-6       L

2013                NLDS  4                      ATL    GS-6    W

2013                NLCS  6                      STL     GS-5    L

2014                NLDS  4                      STL     GS-7    L

2016                NLDS  5                      WSN   9-GF   W

2016                NLCS  6                      CHC    GS-5    L

2017                NLCS  5                      CHC    GS-6    W

2017                WS      7                      HOU   3-6       L

2018                NLCS  7                      MIL    9-GF   W

2018                WS      5                      BOS    GS-7    L

Let’s take a look back at Kershaw’s postseason relief appearances. Everyone remembers his postseason clunkers (though he has had his fair share of stellar performances – 6 starts of 7+ IP, 1 R or fewer) but you may not remember all, if any of Kershaw the postseason reliever. Here are the few note-worthy ones. He appeared in several games in the 2008 and 2009 LCS in relatively low-leverage spots.

 2016 NLDS, Game 5

The Line: 1 app, 0.2 IP, 0 H, 0 R, 1 K, 0 BB, SV

Potentially his most memorable moment came in a winner take all Game 5 of the 2016 NLDS against…the Washington Nationals. After LA starter Rich Hill lasted just 2.2 innings, a trio of relivers –one being Julio Urias, combined to log the middle 3.1 innings. Dodgers “closer” Kenley Jansen was forced to enter the game three batters into the 7th inning with LA clinging to a one run lead. After striking out Trea Turner to lead off the 9th, Jansen who was clearly laboring, issued free passes to Bryce Harper and Jayson Werth. First year skipper, Dave Roberts called on Kershaw to secure the game’s final two outs, still holding on to that one run lead. Seven pitches and two outs later, Kershaw had the first save of his big league career and the Dodgers were moving on to the NLCS.

 2017 World Series, Game 7

The Line: 1 app, 4 IP, 2 H, 0 R, 4 K, 2 BB

After earning the Game 1 win as a starter (7 IP, 1 R) and taking a no decision (4.2 IP, 6 R) in Game 5, a 13-12 extra-innings loss at the hand of the Astros, Kershaw found himself back on the mound in Game 7. The Dodgers fell in a hole early after to start Yu Darvish who yielded 5 runs over 1.2 innings of work. Kershaw came in to start the third and proceeded to strikeout four over four scoreless innings, but it was too little too late. LA lost the game and the series, as the Astros won their first World Series title in franchise history.

 2018 NLCS, Game 7

The Line: 1 app, 1 IP, 0 H, 0 R, 2 K, 0 BB

In the decisive Game 7 of last year’s NLCS, Kershaw again followed Jansen nailing down the final outs of a Dodgers postseason series. This time with a much more comfortable 5-1 lead over the Brewers, Kershaw retired Travis Shaw on a groundout before striking out Jesus Aguliar and Mike Moustakas as the Dodgers captured their second consecutive National League pennant.


The usage of starting pitchers in relief during the postseason

By Jeff Lombardi Jr.

Max Fried, J.A. Happ and Max Scherzer all had something in common on Friday: they each worked a scoreless eighth inning en route to a postseason victory for their club. Another thing they have in common: they are all starting pitchers.

 Besides Friday and other recent instances, starting pitchers have shown value as relief pitchers. Before Chris Sale and Charlie Morton closed out each of the last two fall classics, there were the likes of Randy Johnson (G5 1995 ALDS, G7 2001 WS), Pedro Martinez (G5 1999 ALDS), Mike Mussina (G7 2003 ALCS) and Madison Bumgarner (G7 2014 WS) … just to name a few. However, over the past six postseasons there has been a dramatic increase in the number of relief appearances made by starting pitchers.

Postseason Relief Appearances by Starting Pitchers
Since 2014

2014    15        (in 32 games)

2015    26       (in 36 games)

2016    10        (in 35 games)

2017    38        (in 38 games)

2018    51        (in 33 games)

2019    7          (in 8 games)

*“Starting Pitchers” – Min. 20 starts in regular season

The number jumped from ten in 2016 to 38 in 2017. In 2017, Kenta Maeda and Ross Stripling went from the Dodgers rotation to the bullpen; John Lackey and David Price did the same for the Cubs and Red Sox, respectively. But more importantly, 2017 saw a few top-flight pitchers appear as both starters and relievers. Lance McCullers Jr. earned the save in Game Seven of the ALCS and started Game Seven of the World Series. Charlie Morton closed out Game Seven of the World Series.

 The league-wide number of relief appearances increased to 51 last season, when Alex Cora busted down the door that A.J. Hinch left ajar in 2017. The 2018 World Series winners entered October with a bullpen which was their speculated Achilles heel heading into October. So Cora got creative to find a solution.

 Of 55 Boston relief appearances, 15 were made by pitchers who made at least 20 starts during the regular season (27.2%). Of the Red Sox 63 relief innings, 18 were thrown by starting pitchers (28.6%) – the highest percentage of any team in last year’s postseason. With relief appearances from starters Chris Sale, Rick Porcello, David Price and Nathan Eovaldi, Cora demonstrated that aces can be effective in relief, even between starts. (Eovaldi earned a healthy $68M free agent contract thanks large-in-part to his 9.1 innings of one run ball as a reliver in the postseason.)

 Through eight postseason games in 2019, there have been seven relief appearances made by six starting pitchers – the list: Stephen Strasburg, Max Fried (2), Kenta Maeda, Kyle Gibson, J.A. Happ and Max Scherzer.

 How they’ve fared… 

            IP        ERA    WHIP  K/BB

2014    26.2     2.70     0.94     24/9

2015    32        6.19     1.47     31/13

2016    13        5.54     1.46     13/6

2017    72        3.50     1.03     78/26

2018    61        3.39     1.23     65/23

2019    9.2       2.79     0.93     16/4

Total   214.1   3.86     1.19     227/81

Not too shabby.

 This is not to diminish the importance of a strong bullpen when it comes to making a deep run in October. Just refer to the 2015 Kansas City Royals, whose bullpen pitched to a 2.51 ERA over 64.2 innings during their World Championship run. The only starting pitcher to appear out of the bullpen for that KC club was Danny Duffy, who threw six innings and allowed four runs.

 In recent years, postseason play has in fact diminished the distinction between starter and reliver; especially as the rounds play on. Thus, bridging the gap between the traditional way of thinking (relying on starting pitching) and managing and today’s forward-thinking game where starting pitchers are rarely allowed to face a lineup for the third time.

Percentage of Relief Innings Pitched by SP

MLB Postseason 2014-2019

            SP IP              RP IP              Relief IP by SP          % of Relief IP by SP

2014    356                  239                  26.2                             11.2%

2015    396.2               258.2               32                                12.4%

2016    357.2               272.1               13                                4.8%

2017    359.2               313                  72                                23%

2018    309                  305.1               61                                20%

2019    83.2                 55.1                 9.2                               17.4%

Looking at the 2017 and 2018 postseasons, two out of every nine relief innings have been thrown by a starting pitcher. In all, “starting pitchers” (based on their min. 20 GS in the regular season) have accounted for 5.2 innings per game over the last two postseasons – no matter whether the innings came in a start or in relief – equaling the average of MLB starters in the regular season. So despite all the calls to the bullpen in the postseason, the league-wide usage of true relief pitchers is slightly lower than what it is over 162, and the usage of starting pitchers in relief roles during the postseason is only trending up.


My Favorite Stat of the 2019 MLB Season

By Jeff Lombardi Jr.

The Yankees set the single-season records for most home runs against in opponent (61) and at an opponents ballpark (43) the 2019 Orioles. My favorite way of putting the Yankees dominance of the Orioles into perspective is by comparing their season stats against Baltimore to Ken Griffey Jr.’s stats during his unanimous AL MVP season in 1997. In just 65 more plate appearances, the 2019 Yankees totaled the same amount of doubles and RBI against the Orioles as Jr. did in ’97, while their batting average was separated by just one point!

As you can see, the Bombers and Jr. were very comparable in other categories as well, differing in four points in on-base percentage, 14 points in slugging percentage and five home runs. New York and ’97 Jr. had identical figures in OBP (.382), SLG (.646) and HR (56) through their first 16 games against Baltimore this season

 1997 Ken Griffey Jr. — 2019 NYY vs. BAL

704         PA          769

.304        AVG       .303

.382        OBP       .386

.646        SLG        .632

56           HR          61

34           2B           34

147         RBI         147

*Griffey was unanimously named 1997 AL MVP

Machado Heads West: Star Infielder Signs Record Free Agent Deal with Padres


Courtesy of @si_mlb.

The wait is over. 114 days after playing his final game for Los Angeles Dodgers in Game 5 of the 2018 World Series, infielder Manny Machado has a new home.

On Tuesday the 26 year-old infielder signed a 10-year, $300 million deal with the San Diego Padres. The deal is the largest free agent contract in American sports history. The deal includes an opt-out after the fifth year (2023).

According to Ken Rosenthal, the Chicago White Sox had an offer in place for Machado that was worth $250 million over eight years. The deal reportedly included incentives that would push the value of the deal above $300 million.

Machado spent the first 6 1/2 years of his career with the Baltimore Orioles, before being dealt mid-season to the eventual National League champion, Los Angeles Dodgers.

After what was considered a down year for Machado’s standards in 2017, Machado returned to all-star form last season, hitting .297 with 37 home runs and 108 RBI between the two clubs. Over the course of his career he has been named to four all-star teams, while winning a pair of gold glove awards at third base. He placed top five in the American League MVP vote in both 2015 and 2016.

For San Diego, the deal for Machado comes just one year after they signed first baseman Eric Hosmer to the most lucrative free agent deal in franchise history: an eight year deal worth $144 million. It has been 20 years since the club’s last postseason series win. San Diego has not made made the postseason since winning back-to-back NL West division titles in 2005-2006.

Although it is entirely too early to evaluate the deal, Machado will likely continue to draw comparisons to Alex Rodriguez who signed a 10-year, $252 million contract after his age 24 season. At that point in his career Rodriguez had played in 790 games over seven seasons with a .309 batting average along with 189 home runs and 595 RBI. In comparison, Machado has played in 962 games over seven seasons with a .282 batting average, 175 home runs and 513 RBI.

Smith, Baines Earn Cooperstown Enshrinement

Photo courtesy of Mary DeCicco/MLB Photos.

A pair of former baseball specialists, who had longevity on their side, got their respective calls to be inducted into the National Baseball Hall of Fame and Museum via the Today’s Game committee on Sunday.

Lee Smith and Harold Baines will join an induction class that will likely feature fellow closer Mariano Rivera and designated hitter Edgar Martinez for the 83rd annual induction ceremony in Cooperstown, N.Y. this coming July.

Smith received 100 percent of the vote from the 16 members on the Today’s Game voting panel after yielding just 34.2 percent in his 15th and final appearance on the writers ballot in 2017.

Over 18 seasons with eight clubs from 1980-1997, Smith notched 478 saves, becoming the first in MLB history to reach 400 saves and setting the all-time mark that he held from 1993-2006.  He lead the league in the category four times, in addition to leading the league in appearances on three separate occasions en route to totaling 803 in his career, ranking him third all-time at the time of his retirement.

Smith attained seven all-star selections and three Rolaids Relief awards – the most in the award’s 36 year history spanning 1976-2012, while finishing in the top five of the Cy Young Award voting – including a runner-up finish in 1991 when he appeared in 67 games, securing 47 saves and 67 strikeouts with a 2.34 ERA over 67 innings.

Baines received the minimum 12 of 16 votes (75 percent) for election from the Today’s Game Committee, after peaking at just 6.1 percent of the ballot before falling off the ballot in his fifth year, falling below the five percent threshold.

A .289 career hitter with 2,866 hits, 384 home runs and 1,628 RBI, Baines played in the big leagues for 22 seasons from 1980 through 2001 with five organizations, most notably with the Chicago White Sox whom he spent the first 10 seasons of his career. In Chicago, he earned four of his six career all-star selections, four top-10 MVP finishes and a Silver Slugger award in 1989.

Injuries over the back half of his career limited him to an exclusive designated hitter role. Overall, Baines played 1,643 games as a designated hitter, the most in MLB history at the time of his retirement, which has since been surpassed by David Ortiz.

Baines will become the second player inducted into the HOF to have spent the majority of their career (60.7 percent) as a designated hitter; the other being Frank Thomas, and will join Ken Griffey Jr. and Chipper Jones as the only former No. 1 draft picks to reach the pinnacle of the sport.

2018 World Series Champions: The 2014 Detroit Tigers

Like any front office executive, Boston Red Sox president of baseball operations and general manager, Dave Dombrowski, has always had World Series aspirations. The 2018 Red Sox World Series championship–their fourth in 15 years following an 86-year championship drought, is the second for Dombrowski, his first with an American League team; 30 years after he became the youngest general manager in Major League Baseball with the Montreal Expos in 1988.

Much like his first World Series championship with the 1997 Florida Marlins, who defeated the Cleveland Indians in seven games, Dombrowski leaned on a few familiar faces to turn bring his blueprint to the forefront.

Dombrowski was the a member of the Chicago White Sox front office from 1978-1986, working his way up to assistant general manager by the end of his tenure. Well regarded skipper, Jim Leyland was the White Sox third base coach from 1982-1985, prior to his first managerial gig with the Pittsburgh Pirates from 1986-1996.

Image result for dombrowski leyland illich

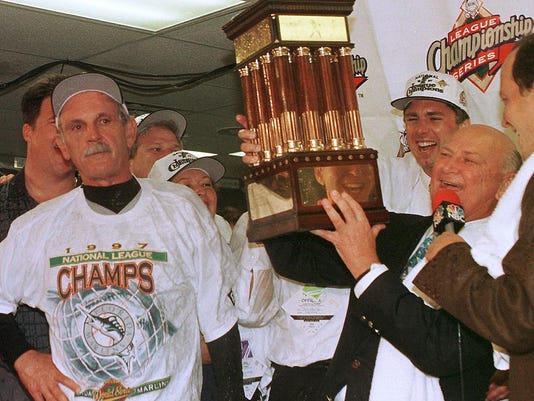
Dave Dombrowski (center) pictured with Jim Leyland (left) after winning the 1997 NLCS with the Florida Marlins. Photo Credit: Robert Sullivan/Getty Images


Fast forward to 1997, Dombrowski now in his fifth year as the general manager of the expansion Marlins who were still seeking their first winning season, Dombrowski turned to a familiar face in Leyland who lead the club to a 92-70 record during the regular season and their first World Series victory. Even off-season acquisitions, outfielders Bobby Bonilla and Cliff Floyd had previous ties to Dombrowski–Bonilla, a Rule 5 selection by the White Sox in 1985 before playing for Leyland in Pittsburgh from 1986-1991 and Floyd who was drafted by Dombrowski during his tenure with the Montreal Expos in 1991.

After making the move to the American League in 2002, joining the Detroit Tigers as the president and chief executive officer before adding general manager to his title, Dombrowski turned to Leyland in 2006 to right the ship after Detroit lost 90 plus games in each of his first four seasons with the club. Leyland had spent 18 years with the Tigers organization, the first seven as a catcher in their minor league system from 1964-70, followed by a stint as the class-A manager from 1972 through 1981.

The Detroit Tigers Dave Dombrowski puts the new Tiger

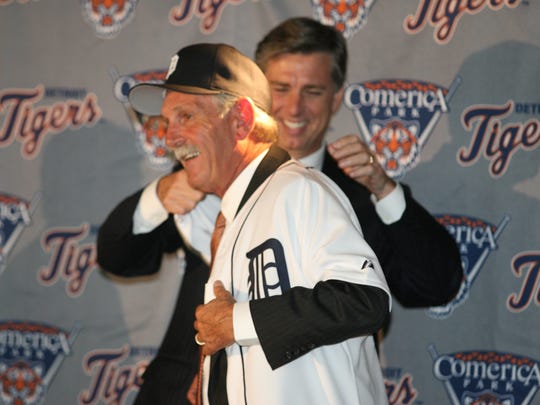
Dombrowski pictured assisting Leyland in putting on his Detroit Tigers jersey at his introductory press conference on Oct. 4, 2005. Photo Credit: Julian H. Gonzalez, Detroit Free Press

Under the eventual 2006 BBWAA Manager of the Year selection; Leyland’s tutelage, the ’06 Tigers would go on to win 95 games that season, their most since 1987, defeating the New York Yankees and Oakland Athletics en route to the their first World Series appearance since 1984, where they would fall to the St. Louis Cardinals in five games.

Prior to the 2008 season, Dombrowski traded for budding superstar, Miguel Cabrera, whom he signed as an amatuer free agent in 1999 amidst his tenure with the Marlins when Cabrera was just 16 years-old.

Although Cabrera never played for Leyland during his time in Florida, the two members of the Dombrowski executive tree flourished in Detroit–reaching three consecutive ALCS from 2010-2012 including a World Series birth in 2011. Cabrera was named to the AL all-star team in three of his first five seasons in Detroit, earning a pair of Silver Slugger Awards and taking home Triple Crown and MVP honors in 2012.

Following the 2013 season Leyland retired from managing, remaining with the Tigers organization as he assumed a role as a special assistant.

The 2014 season brought enense expectations to Detroit, following three consecutive AL Central division titles, the extensive financial commitment to players such as Cabrera and Justin Verlander with a payroll over $180 million and the burning desire of aging owner Mike Illitch to bring a World Series title to the city of Detroit.

Ian Kinsler, J.D. Martinez, Rick Porcello and David Price all have one thing in common. They were all members of the 2014 Tigers   and the 2018 Red Sox.

The 2014 Detroit Tigers are World Series champions. Well, some of them. In a plan that just came to fruition four years late.

Usatsi 8709092 115794393 Lowres

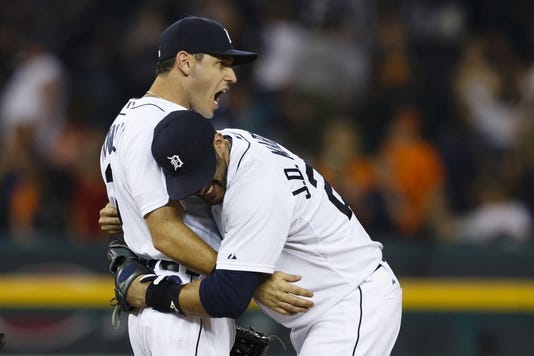
Ian Kinsler and J.D. Martinez as members of the Detroit Tigers. Photo Credit: Photo: Rick Osentoski, USA TODAY Sports

In the 2013 offseason, Dombrowski acquired Kinsler from the Texas Rangers in a trade involving fellow all-star Prince Fielder, before signing J.D. Martinez to a minor league deal prior to Spring Training in 2014. Porcello had been drafted by Dombrowski  with the 27th overall selection in the 2007 first-year player draft out of Seton Hall Preparatory School in West Orange, N.J., fast tracking him to the big leagues, as the youngest player at the age of 21 in 2009.

Price was acquired in a three-team July 31 deadline deal, involving the Tampa Bay Rays and Seattle Mariners.

The foursome accounted for four of the top 10 in WAR for the 2014 Tigers who went on to win 90 games, securing their fourth consecutive division title, before suffering a division series exit on the hands of the Baltimore Orioles.  Kinsler paced the club with a 5.8 WAR, with 188 hits at a .275 clip with 17 home runs, 40 doubles, 15 stolen bases, 92 RBI and 100 runs scored, while being selected to the American League all-star team. Martinez and Porcello both accumulated WAR’s of 4.5, good for fourth on the club. Martinez hit .315, slugging .553 with 23 home runs 30 doubles and 76 RBI, while Porcello’s 15 wins and 3.43 ERA over 204 2/3 innings ranked second among qualifiers on the club. Price 1.7 (10th) picked up four wins with a 3.59 ERA, fanning 82 over 77 2/3. after making just 11 starts.

Image result for porcello price tigers

David Price and Rick Porcello as members of the Detroit Tigers.

Dombrowksi was relieved of his duties following a 60-69 start through the first 129 games of the 2015 season, ending a 14 year reign which resulted in five postseason appearances and two American League pennants.

In the same 2015 season, two weeks later Dombrowski was named president of baseball operations of the Boston Red Sox–reuniting him with Porcello whom he traded to Boston following the 2014 season. In the 2015 off-season, his first as a member of Boston’s front office, Dombrowski inked Price to a seven-year/$217 million contract after trading Price to Toronto before his mid-season departure. J.D. Martinez joined the reunion party prior to the 2018 season, signing a five-year/$110 million deal. Like Price in 2014, Kinsler was a mid-season acquisition–joining Boston in a July 30 deal with the Los Angeles Angels.

Ex-Tigers slugger J.D. Martinez dons Red Sox

Dave Dombrowski (left) and J.D. Martinez pictured at Martinez’ Red Sox introductory press conference on Feb. 26 2018. Photo Credit: AP Photo/John Minchillo

Martinez (6.4), Price (4.4) and Porcello (3.3) ranked third, fourth and seventh in WAR for the 2018 Boston club that won a franchise record 108 games during the regular season en route to an AL East division title. Martinez, the starting designated hitter for the AL in the mid-summer classic, lead the team in both home runs and RBI with 43 and 130, ranking second in the AL, while scoring 111 runs and  slashing .330/.402/.629. Price’s 16 victories was good for second on the club behind Porcello’s 17. The two combined to make 63 starts during the regular season, the most of any two Boston starting pitchers, with 8.9 K/9.  Kinsler made  37 appearances, accumulating 32 hits while winning the Gold Glove Award.

Boston Red Sox pitcher David Price holds the championship trophy after Game 5 of baseball's World Series against the Los Angeles Dodgers on Sunday, Oct. 28, 2018, in Los Angeles. The Red Sox won 5-1 to win the series 4 game to 1. (AP Photo/David J. Phillip)

David Price holds the 2018 World Series trophy. Photo Credit: AP Photo/David J. Phillip)

In the postseason, Martinez was a consistent producer–hitting an even .300 on 15 hits, hitting a home run in each round of the postseason, including a solo shot in the seventh inning of the Game 5 clincher against the Dodgers.  Pocello and Price were on the winning pitcher in all three series clinching games–Porcello, ALDS Game 4 over New York and Price in Game 5 of both the ALCS and World Series over Houston and Los Angeles (NL).  Kinsler hit .308 in the division series, including a RBI double in Boston’s 4-3 series clinching victory in Game 4.

The 2018 Red Sox were AL East division champions after a franchise record 108 win season–the most of any team since the 2001 Seattle Mariners, The 2018 Red Sox had an utterly dominant postseason run, winning 11 of 14 games, ending in a duck boat parade down Lansdowne Street–their fourth in 15 years, but the 2014 Detroit Tigers are World Series champions.

Switching Sides: World Series Skippers Cora, Roberts Among Those to Wear Red Socks and Dodger Blue

The 114th edition of Major League Baseball’s fall classic, which is set to begin on Tuesday, Oct. 23 will feature two of the more decorated franchises in the history of the sport–the Boston Red Sox who won a franchise record 108 games during the regular season and the Los Angeles Dodgers who are the first repeat National League pennant winners since the 2008-2009 Philadelphia Phillies.

Both of these two clubs have been the beneficiary of a long lineage of extraordinary talent, including 26; 15 for Brooklyn/Los Angeles and 11 for Boston of those in the 0.01 percentile of MLB players who are enshrined in Cooperstown following their playing career.

The most notable player to play at home in front of the Fenway faithful as well as having the opportunity to don Dodger blue is Hall of Fame starting  pitcher Pedro Martinez. Martinez signed with the Dodgers as an ammeter free agent out of the Dominican Republic in 1988 before eventually making his MLB debut with the club were he made 67 appearances over the 1992-1993 seasons.

with Nomar Garciaparra

Pedro Martinez pictured with Red Sox teammate Nomar Garciaparra. Photo Credit: Walter Iooss Jr./Sports Illustrated

Following a four year stint with the Montreal Expos from 1994-1997, Martinez embodied himself in Red Sox lore as he put together one of the most dominant stretches for a starting pitcher in baseball history, posting a 117-37 mark with a sparkling 2.52 ERA and an American League best, 1,683 strikeouts–leading the league on three separate occasions, en route to winning a pair of AL Cy Young Awards while helping to end an 86 year World Series drought in the final year of his seven year tenure in 2004.

Image result for mannywood dodgers

Manny Ramirez during his tenure with Los Angeles.

Historically, players to have worn the iconic navy cap with an ornate style “B” for Boston or the white interlocking “LA” for Los Angeles have typically had more success or have been best remembered for their time with the Red Sox organization.  This distinction resignates with Red Sox HOF inductees Nomar Garciaparra (BOS 1996-2004, LAD 2006, 2008) and Derek Lowe (BOS 1998-2004, LAD 2005-2008). A pair of Red Sox WS winning outfielders in Manny Ramirez (BOS 2001-2008, LAD 2008-2010) in ’04 and ’07 and J.D. Drew (LAD 2005-2006, BOS 2007-2011) in ’07, and even Doug Mientkiewicz (BOS 2004, LAD 2009) who infamously caught the final out of the 2004 WS.

Exceptions to this include 1995 NL Rookie of the year Hideo Nomo (LAD 1995-1998, 2002-2004, BOS 2001), 2004 NL MVP runner-up Adrian Beltre (LAD 1998-2004, BOS 2010) and 2003 NL Cy Young Award winner Éric Gagné (LAD 1999-2006, BOS 2007) who recorded a MLB record 84 consecutive saves from Aug. 26, 2002 to July 5, 2004 as a member of the Dodgers.

Photo Credit: J. Rogash/Getty Images

Aside from becoming the first duo of minority managers to face one another in the WS, Red Sox manager Alex Cora and Dodgers skipper Dave Roberts are woven into the Red Sox-Dodgers almanac dating back to their playing days. Not only did they each play for both organizations, but they were teammates in Los Angeles from 2002 until the July 31 trade deadline in 2004.

Cora was drafted by Los Angeles in the third round of the 1996 first-year player draft, debuting for the club in 1998 and appearing in 684 games over the six seasons through 2004. After signing with the Cleveland Indians prior to the 2005 season, Cora was dealt to Boston where he would spend the next three and half seasons, which included being a member of the 2007 WS championship team.

Roberts made just 347 regular season appearences between the two clubs (LAD 2002-2004, BOS 2004) but managed to steal 124 bases in that three year span; 118 with Los Angeles, six with Boston and one in the postseason. The onepostseason stolen base in Game 4 of the 2004 ALCS became the highlight of Roberts career.

Image result for dave roberts stolen base

Photo Credit: Jed Jacobsohn/Getty Images

Trailing the New York Yankees three games to none in the best five LCS, with New York clinching to a 4-3 lead in the bottom of the 9th inning, Roberts pinch ran for first baseman Kevin Millar who lead off the inning with a walk.  After three pick-off attempts by New York’s closer, future HOFer Mariano Rivera, Roberts took off for second on Rivera’s the first offering to Bill Mueller, sliding in just ahead of the throw from Jorge Posada. Two pitches later Roberts would score from second on a base hit up the middle by Mueller, tying the game at four.  Boston would go on to win the game 6-4 in 12 innings. Boston did not lose a game for the remainder of the postseason in 2004..and the rest is history.

Two pitchers that figure to play a pivotal role in this series also have their ties between the two clubs. Nathan Eovaldi, the projected game three starter for Boston and Rich Hill, the likely choice for Los Angeles in game four on Saturday night.

Eovaldi was drafted by the Dodgers in the 11th round of the 2008 first-year player draft, making his big league debut less than three years later in 2011 at the age of 21, remaining with the club through the 2012 season.

Following stops in Miami, New York (AL) and Tampa Bay–Eovaldi, now of the Red Sox, made just 12 appearances, 11 starts for Boston during the regular season after being acquired from TB in late July in the midst of his first season back following his second Tommy John surgery. The 28 year-old fireballer has been nothing short of spectacular throughout this postseason, pitching to a tune of a 1.88 ERA over 14 1/3 innings (three appearances, two starts), earning the series clinching victory in Game 4 of the ALDS over New York and Game 3 of the ALCS over Houston.

Regardless of the outcome of this series, Rich Hill, a Milton, Massachusetts native, will always pay homage to the Red Sox organization–for two things: a career revival and for an eventual third stint with the club that lead to him amassing nearly eleven times the amount of his career earnings.

Hill spent the first four seasons of his career with the team that drafted him, the Chicago Cubs from 2005 through 2008, before being traded to Baltimore prior to the 2009 season. Each of next six seasons he signed minor league deals bouncing from St. Louis (2010), Boston (each season from 2010-2012), Cleveland (2013), Boston…again (2014) before being traded to Los Angeles (AL-2014) being DFA’d and signing a mid-season minor league contract with New York (AL-2014), Washington (2015) and even the Long Island Ducks of the independent, Atlantic League of Professional Baseball.  Hill appeared in a major league game in each of these seasons, making 40 appearances with Boston from 2010-2012.

After clawing his way back to the major leagues, after signing a minor league deal in August 2015 with…yup, Boston–third time’s the charm…Hill, then 35, started a MLB game for the first time since 2009, making four September starts going 2-1 with an impressive 1.55 ERA and 36 strikeouts to just five walks over 29 innings.

Rich Hill has gone 2-0 with a 1.17 ERA and 30 strikeouts in 23 innings in September.

Photo Credit: John Tlumacki/Globe Staff

Following his four start audition with the Red Sox, Hill signed a major league deal with the Oakland Athletics for one year/$6 million prior to the 2016 season.  After making 14 starts, going 9-3 with a 2.25 ERA and 90 strikeouts in 76 innings, Hill was dealt to the Dodgers…FINALLY!!

Over six starts with the Dodgers over the final two months of the regular season, Hill continued to dazzle, finishing the season
with a 12-5 mark, 2.12 ERA and 129 strikeouts over 110 1/3 innings.

A free agent at season’s end, Hill signed a three-year, $48 million deal to return to Los Angeles where he has had the most consistent stretch of success in his professional career.

Since 2016 Hill has pitched in 56 games making 55 starts with the Dodgers, accumulating a 26-15 record with a 3.30 ERA in the regular season, in addition to making 10 postseason appearances (nine starts), with a 2.85 ERA and a win in the over the Chicago Cubs in the 2016 NLCS.

Oh…and as for Hill’s wallet, for those keeping score at home, the southpaw has made $54 million of his nearly $60 million career earnings following career reviving stint with Boston in 2015.